21 Oct 2026
Viewer Habits During Major Events Shift Casino Traffic in Measurable Ways
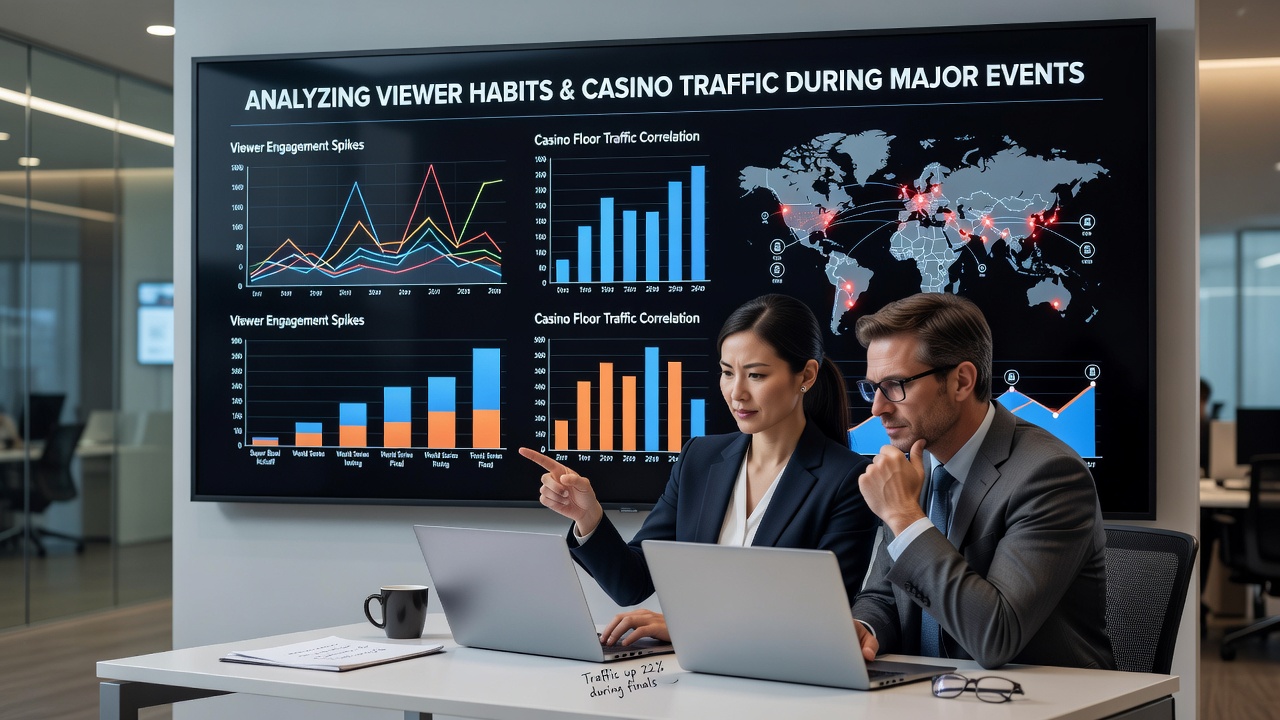
Viewer habits during major televised events create clear patterns in casino attendance, and data collected across multiple markets shows consistent drops in physical visits paired with rises in online activity when audiences stay home to watch. Researchers tracking these trends note that events lasting several hours keep people in front of screens, which reduces spontaneous trips to casino floors while increasing engagement with mobile betting platforms during breaks in programming.
Sports Broadcasts Drive the Strongest Shifts
Championship games and international tournaments produce the most documented changes in casino traffic. Figures from state gaming agencies reveal that Super Bowl Sunday typically sees physical casino visits fall by 15 to 25 percent in major markets, while online casino sessions climb during halftime and post-game windows. Similar patterns appear during Olympic opening ceremonies and World Cup matches, where extended viewing blocks keep audiences stationary for four to six hours at a stretch.
October 2026 will bring another round of qualifying matches for upcoming global tournaments, and analysts expect the same traffic redistribution to repeat. Venues near residential areas report quieter tables and slots on those evenings, whereas remote logins to casino sites increase once viewers finish watching.
Entertainment and News Events Create Different Patterns
Awards shows and national election coverage generate shorter but sharper dips in foot traffic. Studies of Las Vegas and Atlantic City properties indicate that three-hour broadcasts reduce walk-in numbers for the first half of the evening before traffic rebounds once programming ends. Election nights produce steadier but lower volume throughout the night as audiences monitor results across multiple channels.
What's interesting is that these events rarely trigger the sustained online spikes seen with sports, because viewers return to normal routines more quickly once coverage concludes. Casino operators adjust staffing accordingly, moving dealers and hosts to later shifts when audiences finish watching.
Regional Data Reveals Consistent Trends
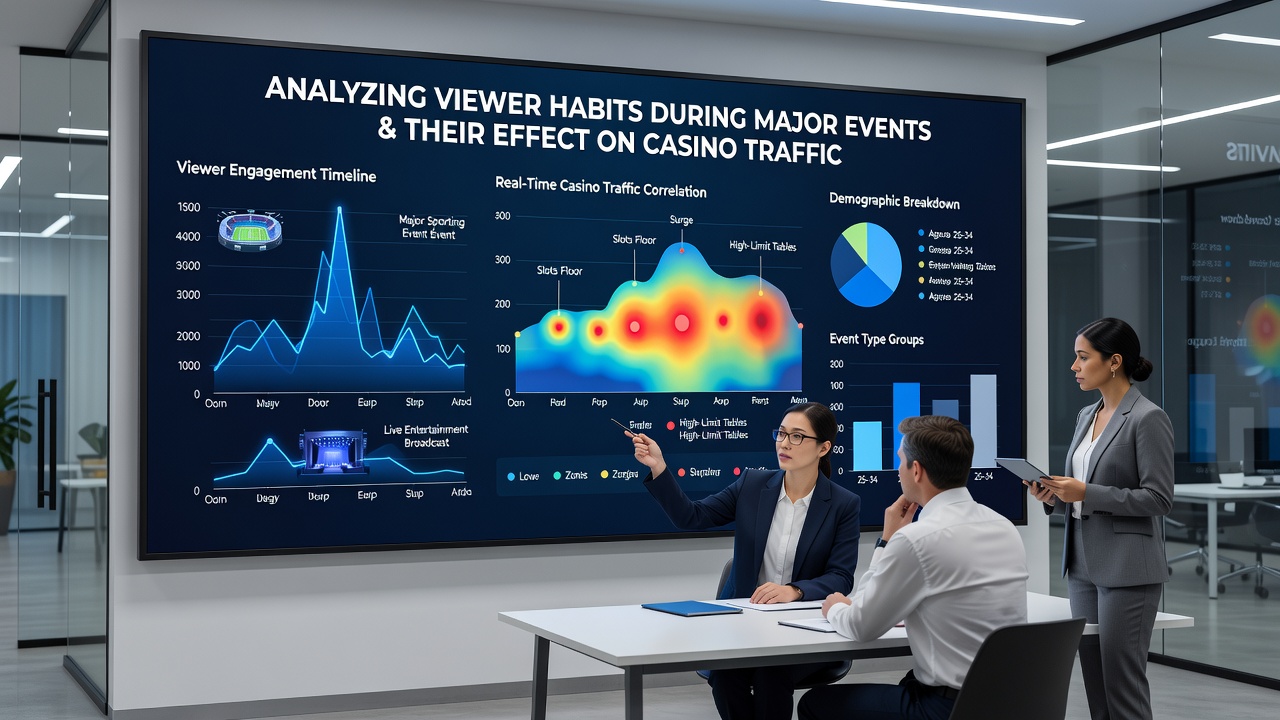
Reports from the Nevada Gaming Control Board document traffic reductions of 18 percent on average during prime-time major events over the past five seasons. Parallel observations from Australian state regulators show comparable drops in New South Wales and Victoria casinos when national team matches air. Canadian provincial data adds further confirmation, with Ontario facilities noting similar evening declines during Stanley Cup finals.
Academic researchers at institutions studying leisure behavior have cross-referenced these figures with television ratings and mobile device usage logs. Their findings indicate that households with multiple screens maintain partial casino app activity even while the main television remains tuned to the event, creating a split-attention model that favors online play over physical visits.
Operator Adjustments and Platform Responses
Casino groups respond to these predictable shifts by promoting in-app features timed to commercial breaks and halftime segments. Push notifications and live dealer tables see higher engagement precisely when physical floors empty. Marketing teams schedule bonus rounds and tournament entries to coincide with event intermissions, capitalizing on the moments when viewers check their phones.
Physical properties counter the trend with targeted promotions aimed at post-event crowds, including extended happy hours and late-night table minimum reductions that begin once broadcasts finish. These tactics help recapture some of the lost traffic later in the evening.
Conclusion
Viewer habits during major events produce measurable, recurring effects on casino traffic that operators now track through combined television ratings, footfall sensors, and digital session data. The patterns hold across sports, entertainment, and news broadcasts, with physical visits declining while online engagement rises in direct relation to program length and audience size. As October 2026 approaches with its schedule of qualifying matches and other large-scale broadcasts, the same traffic dynamics observed in prior years are expected to continue shaping both floor activity and digital platform usage.